
On this page
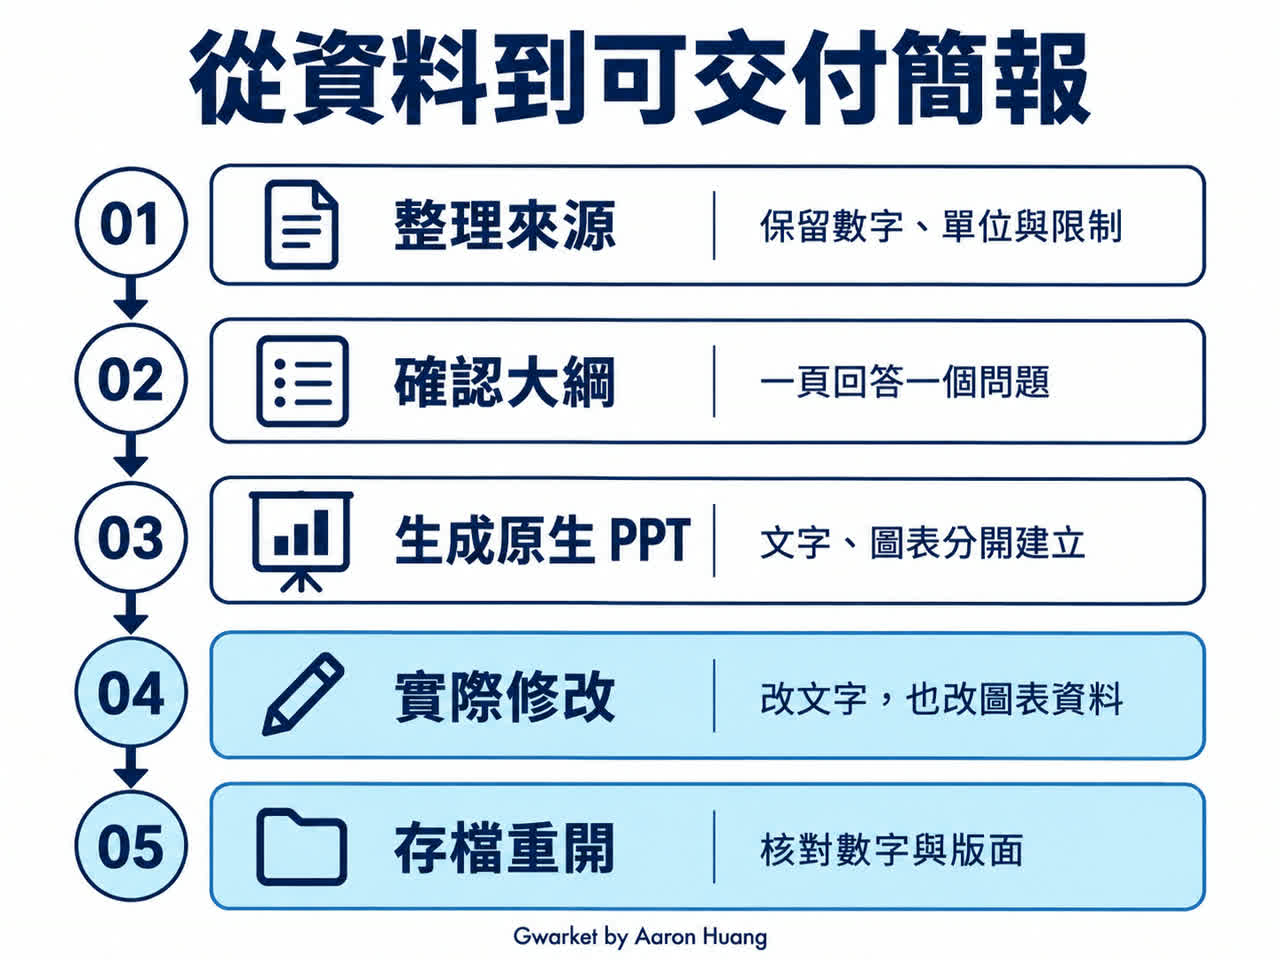
An AI-generated deck is deliverable only when the parts that must change remain editable. A PPTX extension is not enough: edit text, change chart data, save the file, close it, and reopen it before handoff.
This tutorial uses a fictional three-slide webinar review. The exercise was created with native PowerPoint text and chart objects, then tested in Windows PowerPoint 16.0. It is not a benchmark of every AI presentation tool.
What does editable mean in an AI-generated PPT?
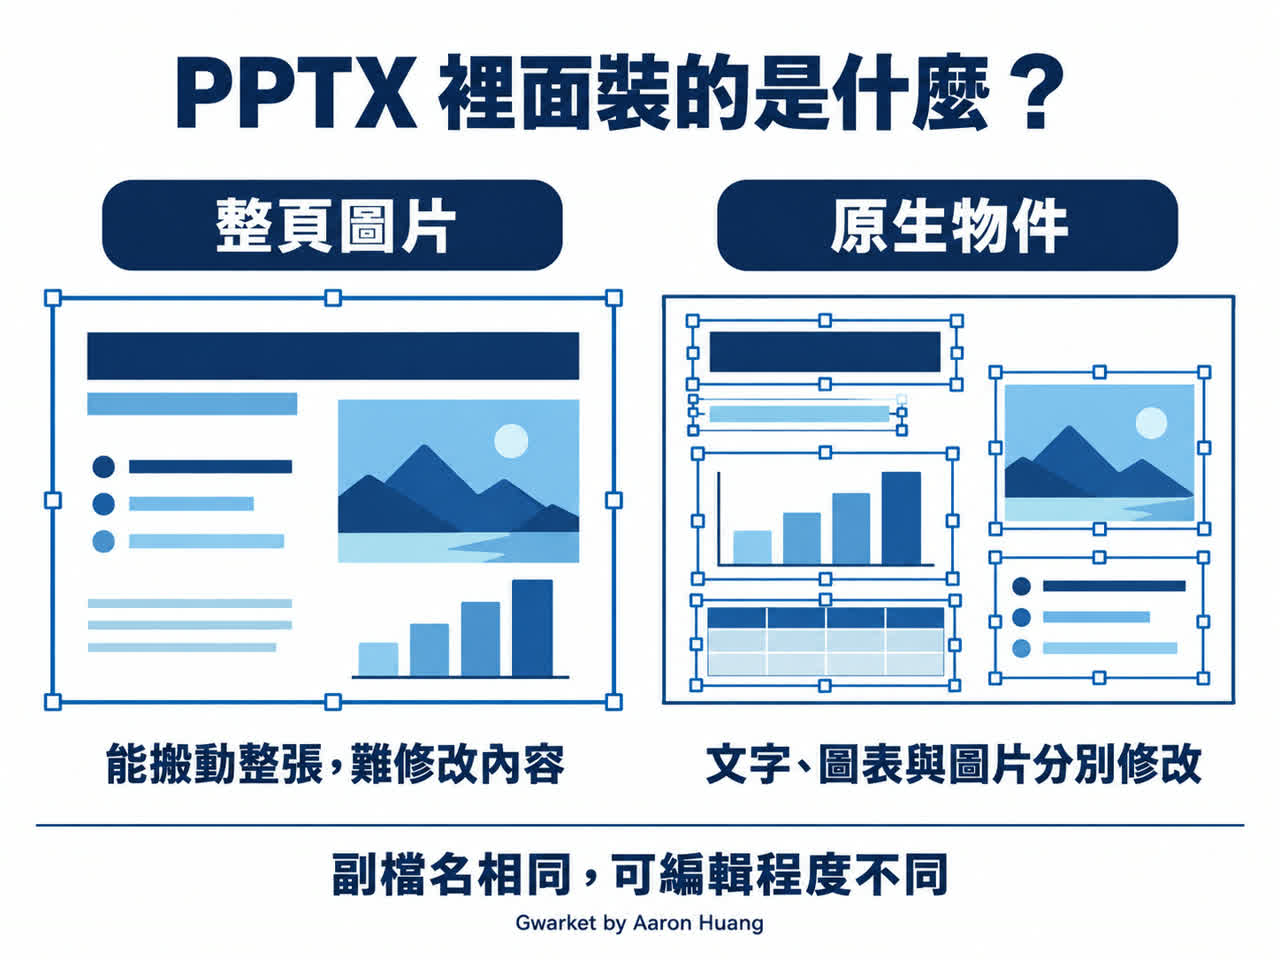
Editability has at least three layers: text can be changed, layout objects can be moved independently, and a chart retains its underlying data. A slide may open in PowerPoint while still being only one flattened image.
| Content | Usually editable | Limit |
|---|---|---|
| Flattened slide image | Crop, resize, move | Text and numbers are pixels |
| Separate text and shapes | Copy, position, color | A chart-like shape may not contain data |
| Native data chart | Series and values | Confirm that the workbook survives save and reopen |
Prepare the decision and source data first
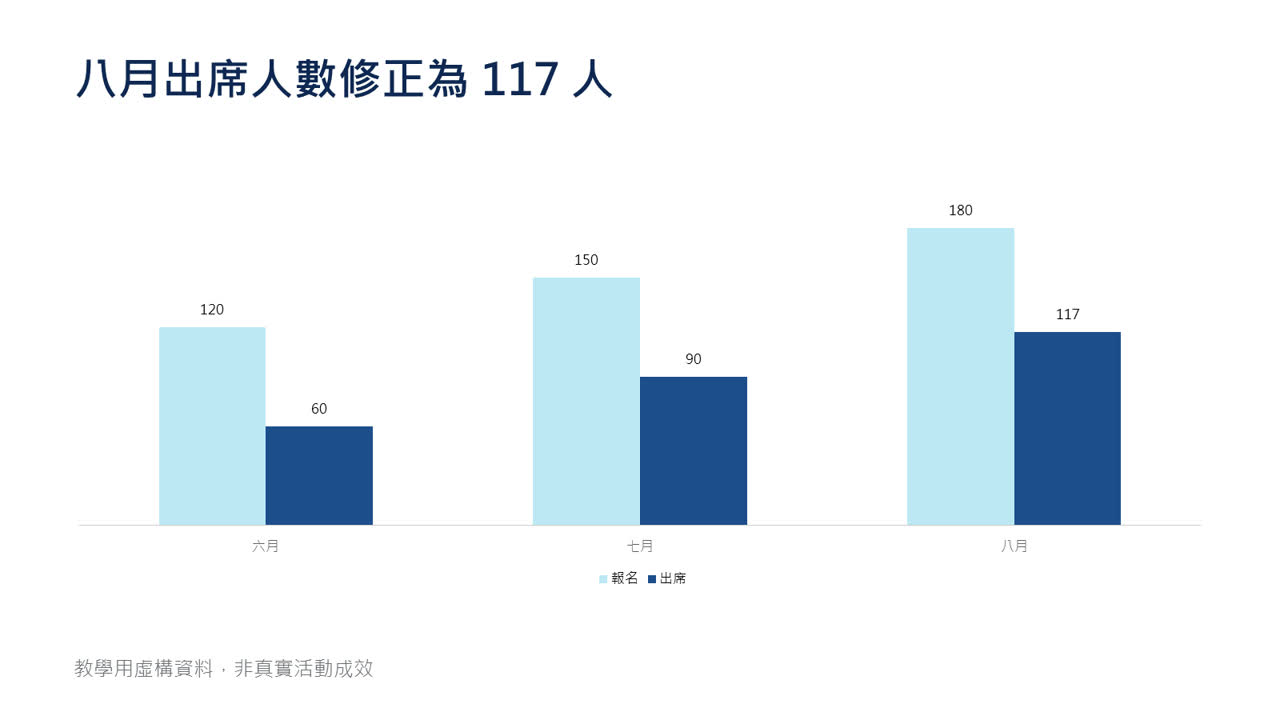
Tell the system who will read the deck and what decision it supports. In this exercise, a marketing manager is considering a reminder test for the next webinar. The fictional data are registrations and attendance only: June 120/60, July 150/90, and August 180/108. Revenue, satisfaction, and causal explanations are not provided.
| Month | Registrations | Attendance | Rate |
|---|---|---|---|
| June | 120 | 60 | 50% |
| July | 150 | 90 | 60% |
| August | 180 | 108 | 60% |
Attendance rate means attendance divided by registrations. Real work must also define the period, denominator, and what counts as attendance. Do not upload customer lists or internal reports unless the account and service are approved for that data.
Turn the source into a slide-by-slide outline
Ask what question each slide answers before asking for layout. A useful three-slide sequence is: decision context, observed registrations and attendance, then a proposed test clearly labeled as a hypothesis.
Audience: marketing manager
Decision: whether to test a reminder for the next webinar
Data: June 120/60; July 150/90; August 180/108
Keep the fictional-data label on every slide.
Do not invent revenue, satisfaction, or a cause for the change.
Specify the required PowerPoint structure
Require native text boxes and a native clustered-column chart with embedded data. State the aspect ratio, colors, labels, fonts, and known limitations. If the environment cannot create a real PPTX, it should say so rather than return images under a misleading filename.
Create a 3-slide, 16:9 PPTX from the approved outline.
Use native text boxes; do not flatten each slide into an image.
Slide 2: native clustered-column chart with its editable embedded data table.
Registrations: 120, 150, 180. Attendance: 60, 90, 108.
Show the legend, months, and value labels; do not rely on color alone.
Use white, navy #0F2854, blue #1C4D8D, and mist #BDE8F5.
Use an installed font that supports Traditional Chinese.
Keep “Fictional teaching data—not real event results” on every slide.
Deliver the PPTX and source data; disclose anything that is not natively editable.
If a real PPTX cannot be produced, say so and do not substitute images.
Microsoft also documents importing a Word outline into desktop PowerPoint: apply Heading 1 to slide titles and Heading 2 to slide content, save and close Word, then use New Slide → Slides from Outline in desktop PowerPoint. This creates text slides; charts and layout still need work, and the web version does not support this import. Copilot availability depends on account, license, and rollout; this exercise did not test Copilot generation.
Run a real edit, save, and reopen test
Edit text
Place the cursor inside a title, replace several words, and move its text box without moving the chart.
Edit chart data
Select the chart, open its data sheet, and change August attendance from 108 to 117. Save to a new file, close PowerPoint, reopen it, and confirm the values are 60, 90, and 117. This exact native edit-and-resave test passed in Windows PowerPoint 16.0.
Any separately written attendance rate must also change from 60% to 65%. Native chart data do not automatically repair conclusions elsewhere in a deck.
Download the original PPTX · Download the edited comparison · Download fictional source data
Treat images as replaceable objects, not editable text
An image can be selected and replaced while the words inside remain pixels. Keep frequently changing titles, figures, and charts as native objects.
Choose a method by the handoff requirement
For recurring reports, predictable data editing matters more than a surprising first render. Start with three slides and deliberately include one data chart; that small test exposes flattened text, fake charts, and broken data editing quickly.
| Method | Useful when | Verify first |
|---|---|---|
| AI outline, manual PowerPoint layout | A company template already exists and the deck is short | Outline order, text density, and figures |
| Presentation product's AI feature | You want a low-setup editable first draft | Account support and exported object structure |
| AI assistant plus presentation generator | You need specified charts, rules, or repeat production | Native objects and rebuild materials |
| Full-slide image inside PPT | One-time display with almost no later editing | Text clarity, image rights, and accepted edit cost |
Check content and layout before delivery
- Compare every number, date, unit, and percentage with the source.
- Inspect wrapping, overflow, legends, and fonts in the recipient's environment.
- Edit one text box, one chart, and one image.
- Save, close, and reopen the file.
- Keep the PPTX, source data, and necessary image originals together.
Know where human judgment remains necessary
AI cannot decide which unsupported statement may represent a team. Complex templates, animation, special fonts, and externally linked charts may require manual repair. This test did not cover macOS, Google Slides, or every Office version.
Frequently asked questions
Does a PPTX download prove that everything is editable?
No. Test a text box and the chart data, then save and reopen.
Why can I move a chart but not edit its numbers?
It may be a picture or a group of shapes rather than a native chart.
Do I need a paid AI presentation tool?
No. You can use AI for the outline and presentation software you already have. Test three slides before paying for a larger workflow.
Does placing an AI-generated image in PowerPoint make the deck editable?
The image can be moved, resized, or replaced, but text and figures inside it are normally pixels. Use images for covers or illustration and keep changing text, numbers, and charts as separate native objects.
References and test boundary
Official pages checked September 9, 2026: create a presentation from an outline, change chart data, and create with Copilot. The native PowerPoint edit test is real; all webinar figures are fictional.